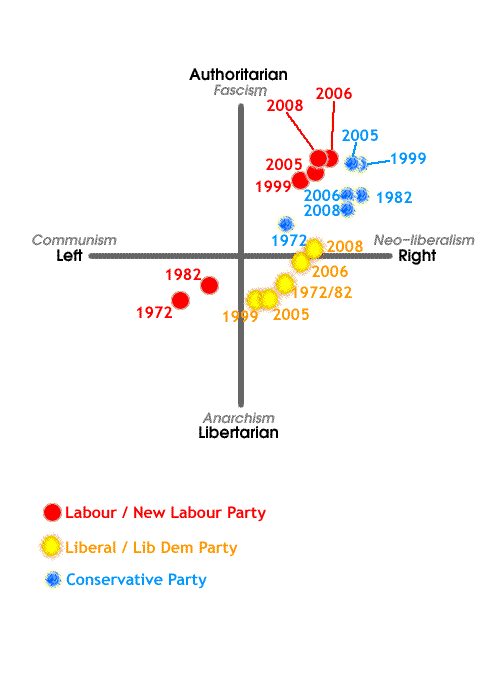
A first glance confirms the shift in Labour over the years to the right - and indeed the Lib Dems. The Tories meanwhile have also moved a little - the differences between them are very small. Read more about it all here:
www.politicalcompass.org/ukparties2010

 The website also has an interesting personal test that allows you to place yourself on the chart and see how close you are to a particular political party - it strangely put me very close to the Green party! It also looks at other elections like the US Presidential elections.
Lastly it is worth also mentioning the independent Vote for Policies, Not Personalities website (www.voteforpolicies.org.uk) that looks at policies - some 167,000 people have taken part and Greens are still ahead. Well worth a look. See also my post yesterday about every vote not being equal.


1 comment:
See The Telegraph
www.telegraph.co.uk/news/election-2010/7675120/General-Election-2010-Nick-Clegg-ready-for-talks-with-future-Tory-government.html
Nick Clegg said electoral reform
promises were not a “precondition” of dealing with a potential Conservative government.
Post a Comment